Demo Gallery
A visual tour of PFun CMA Model's interactive demos, desktop application, and output visualizations.
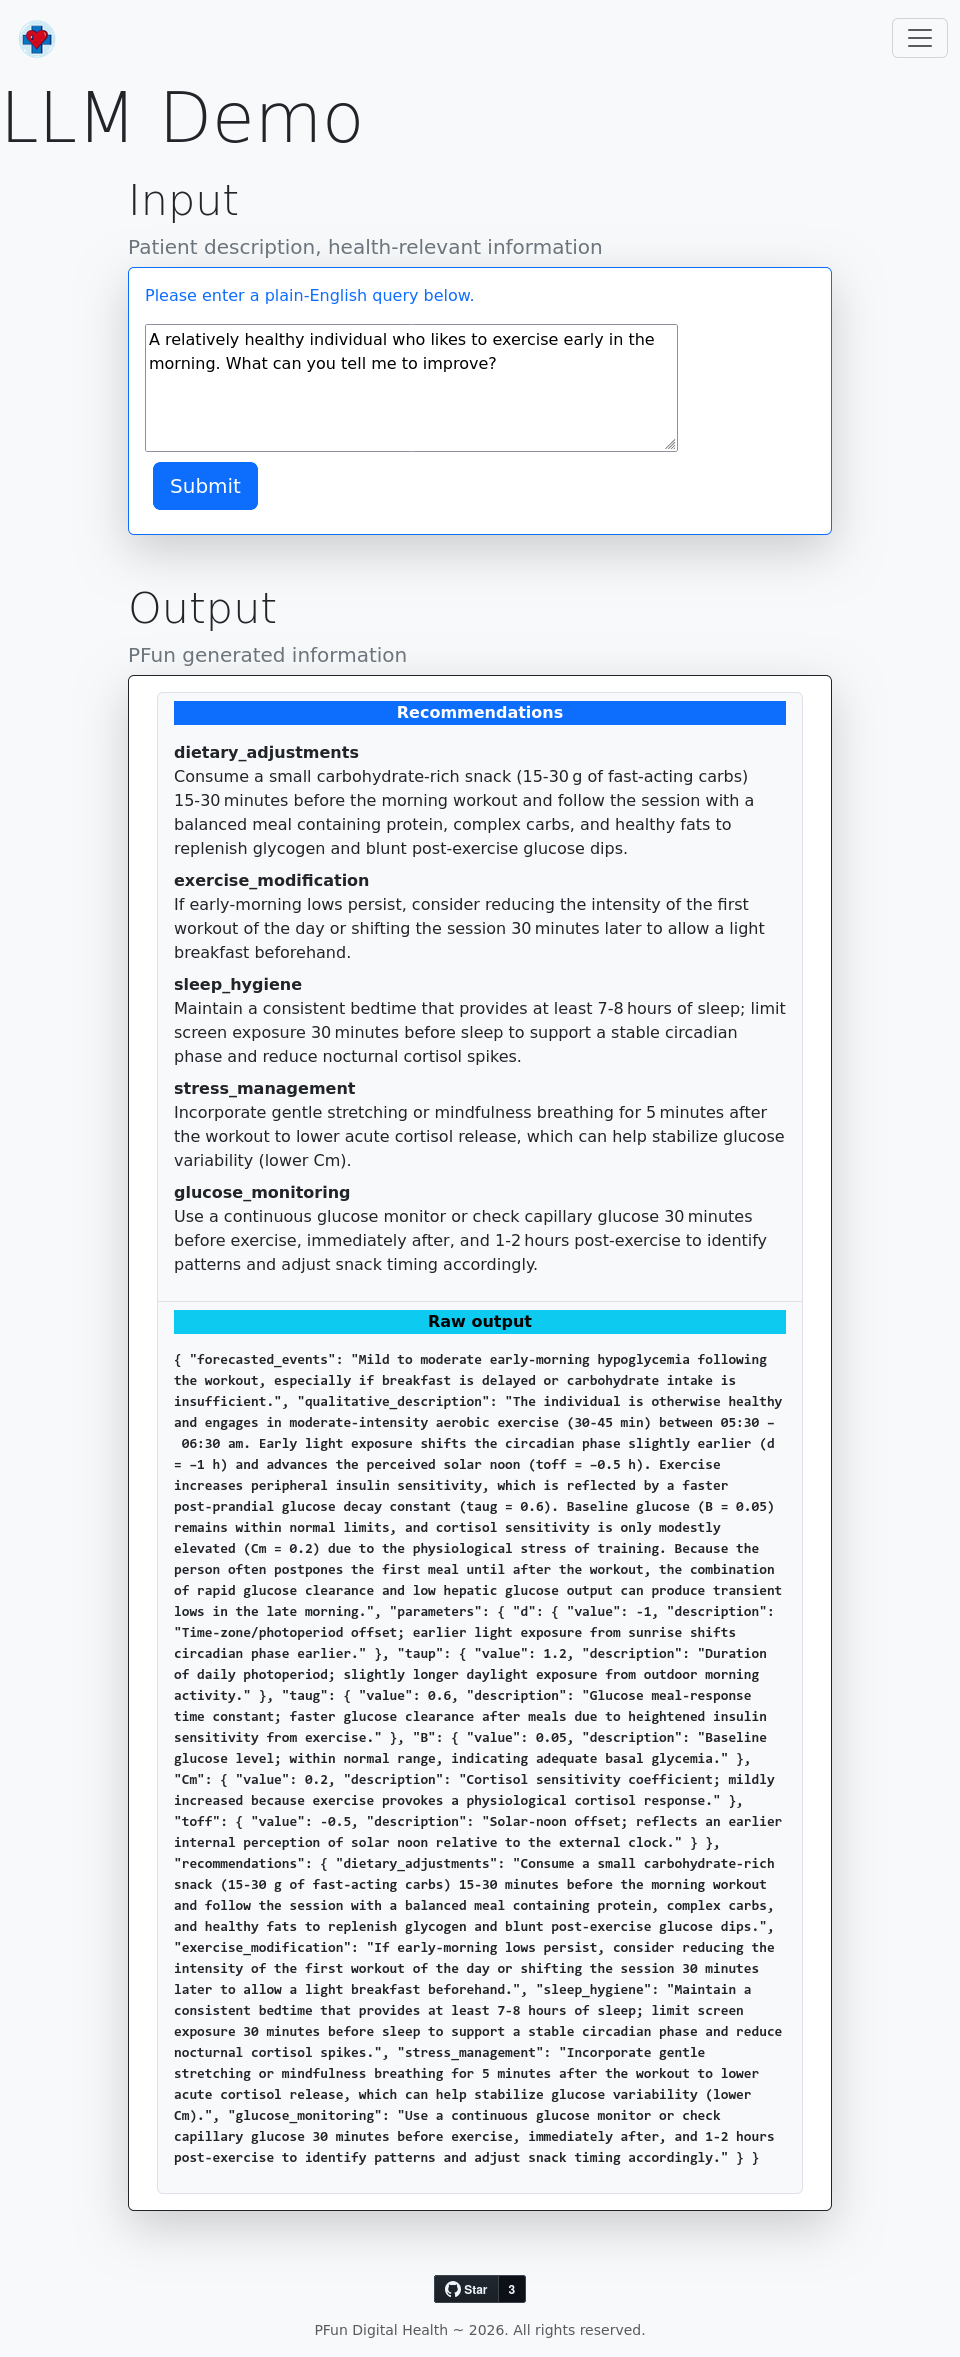
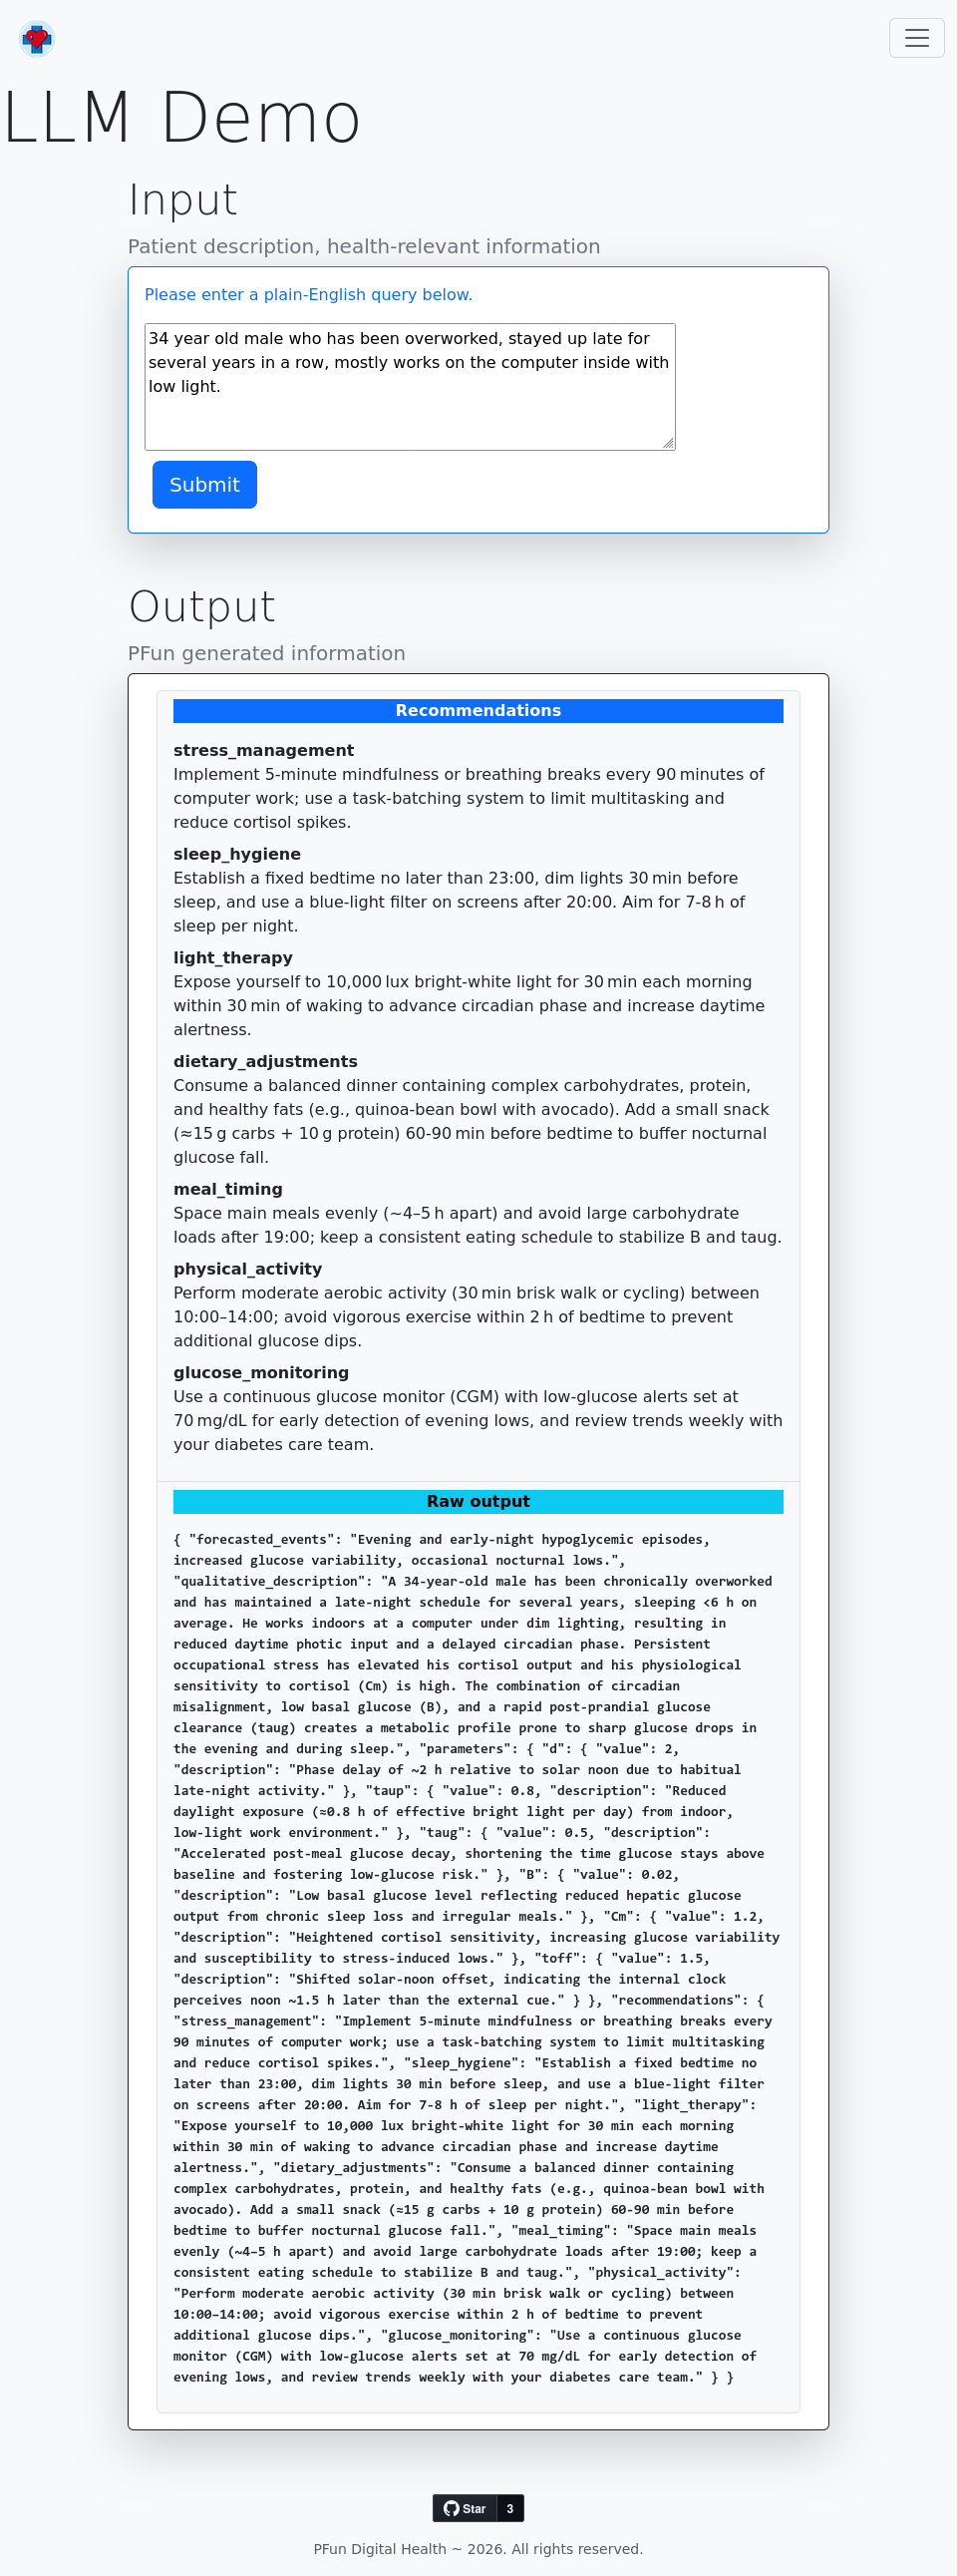
LLM Scenario Generation
Generate physiologically valid scenarios from natural language. The LLM translates qualitative descriptions into CMA model parameters with clinically relevant recommendations.
WebSocket Real-Time Streaming
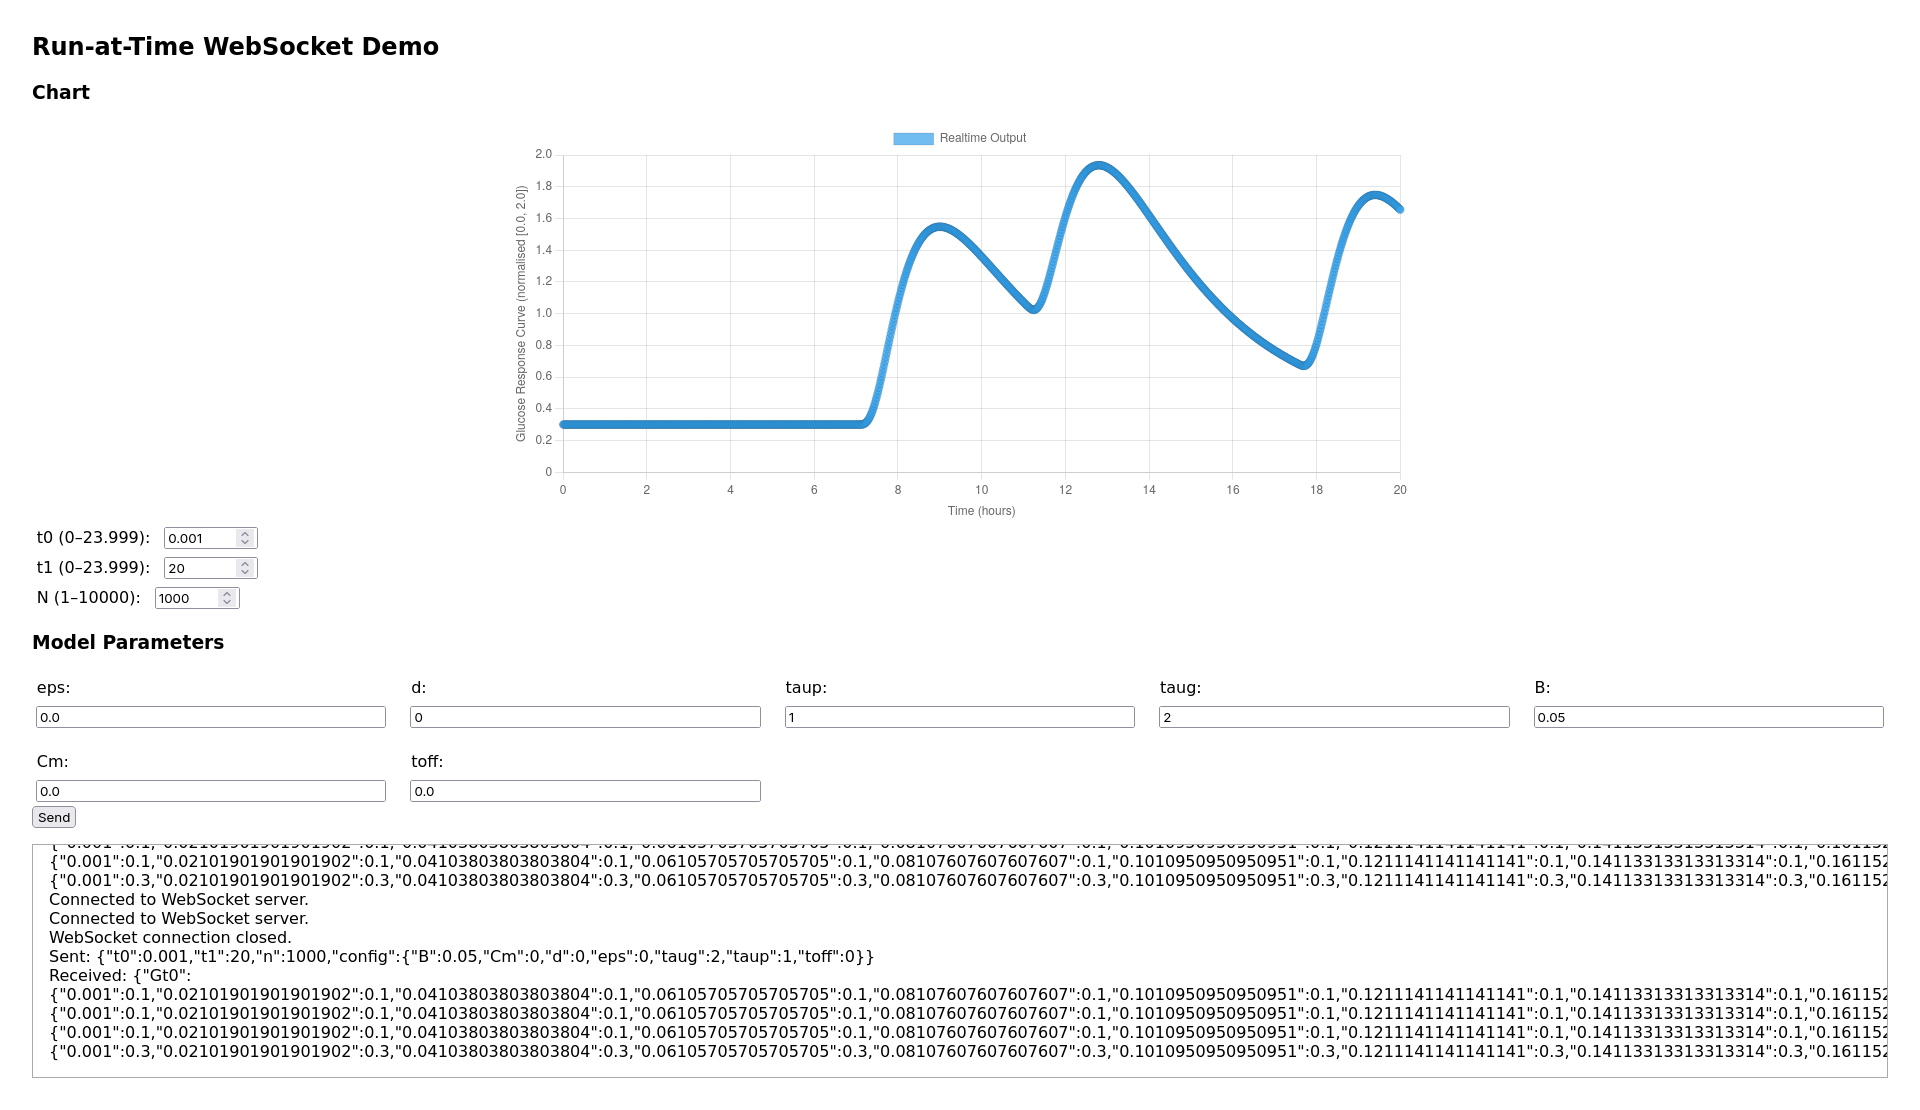
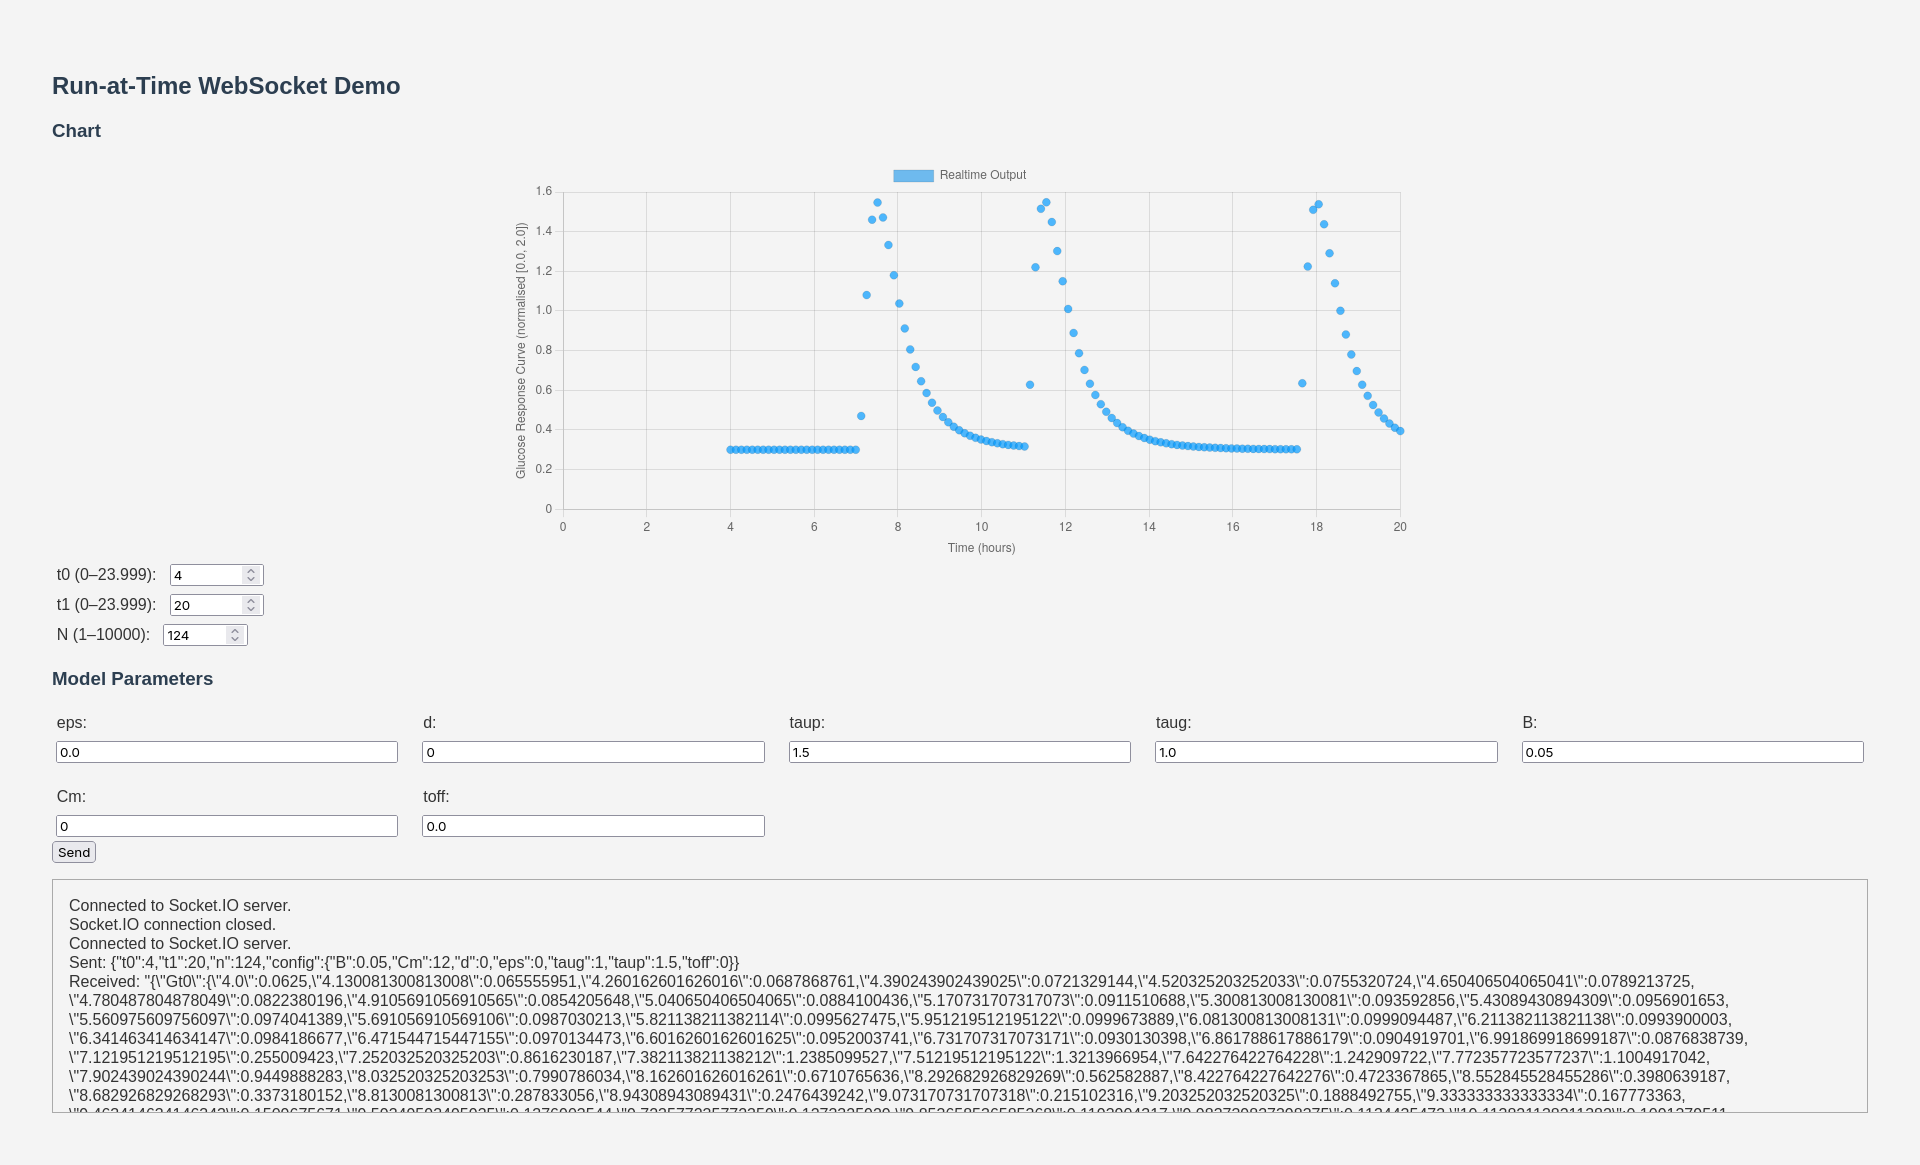
Control model parameters interactively with sliders and see live glucose curve updates via WebSocket:
→ WebSocket Streaming deep dive
Parameter Grid Visualization
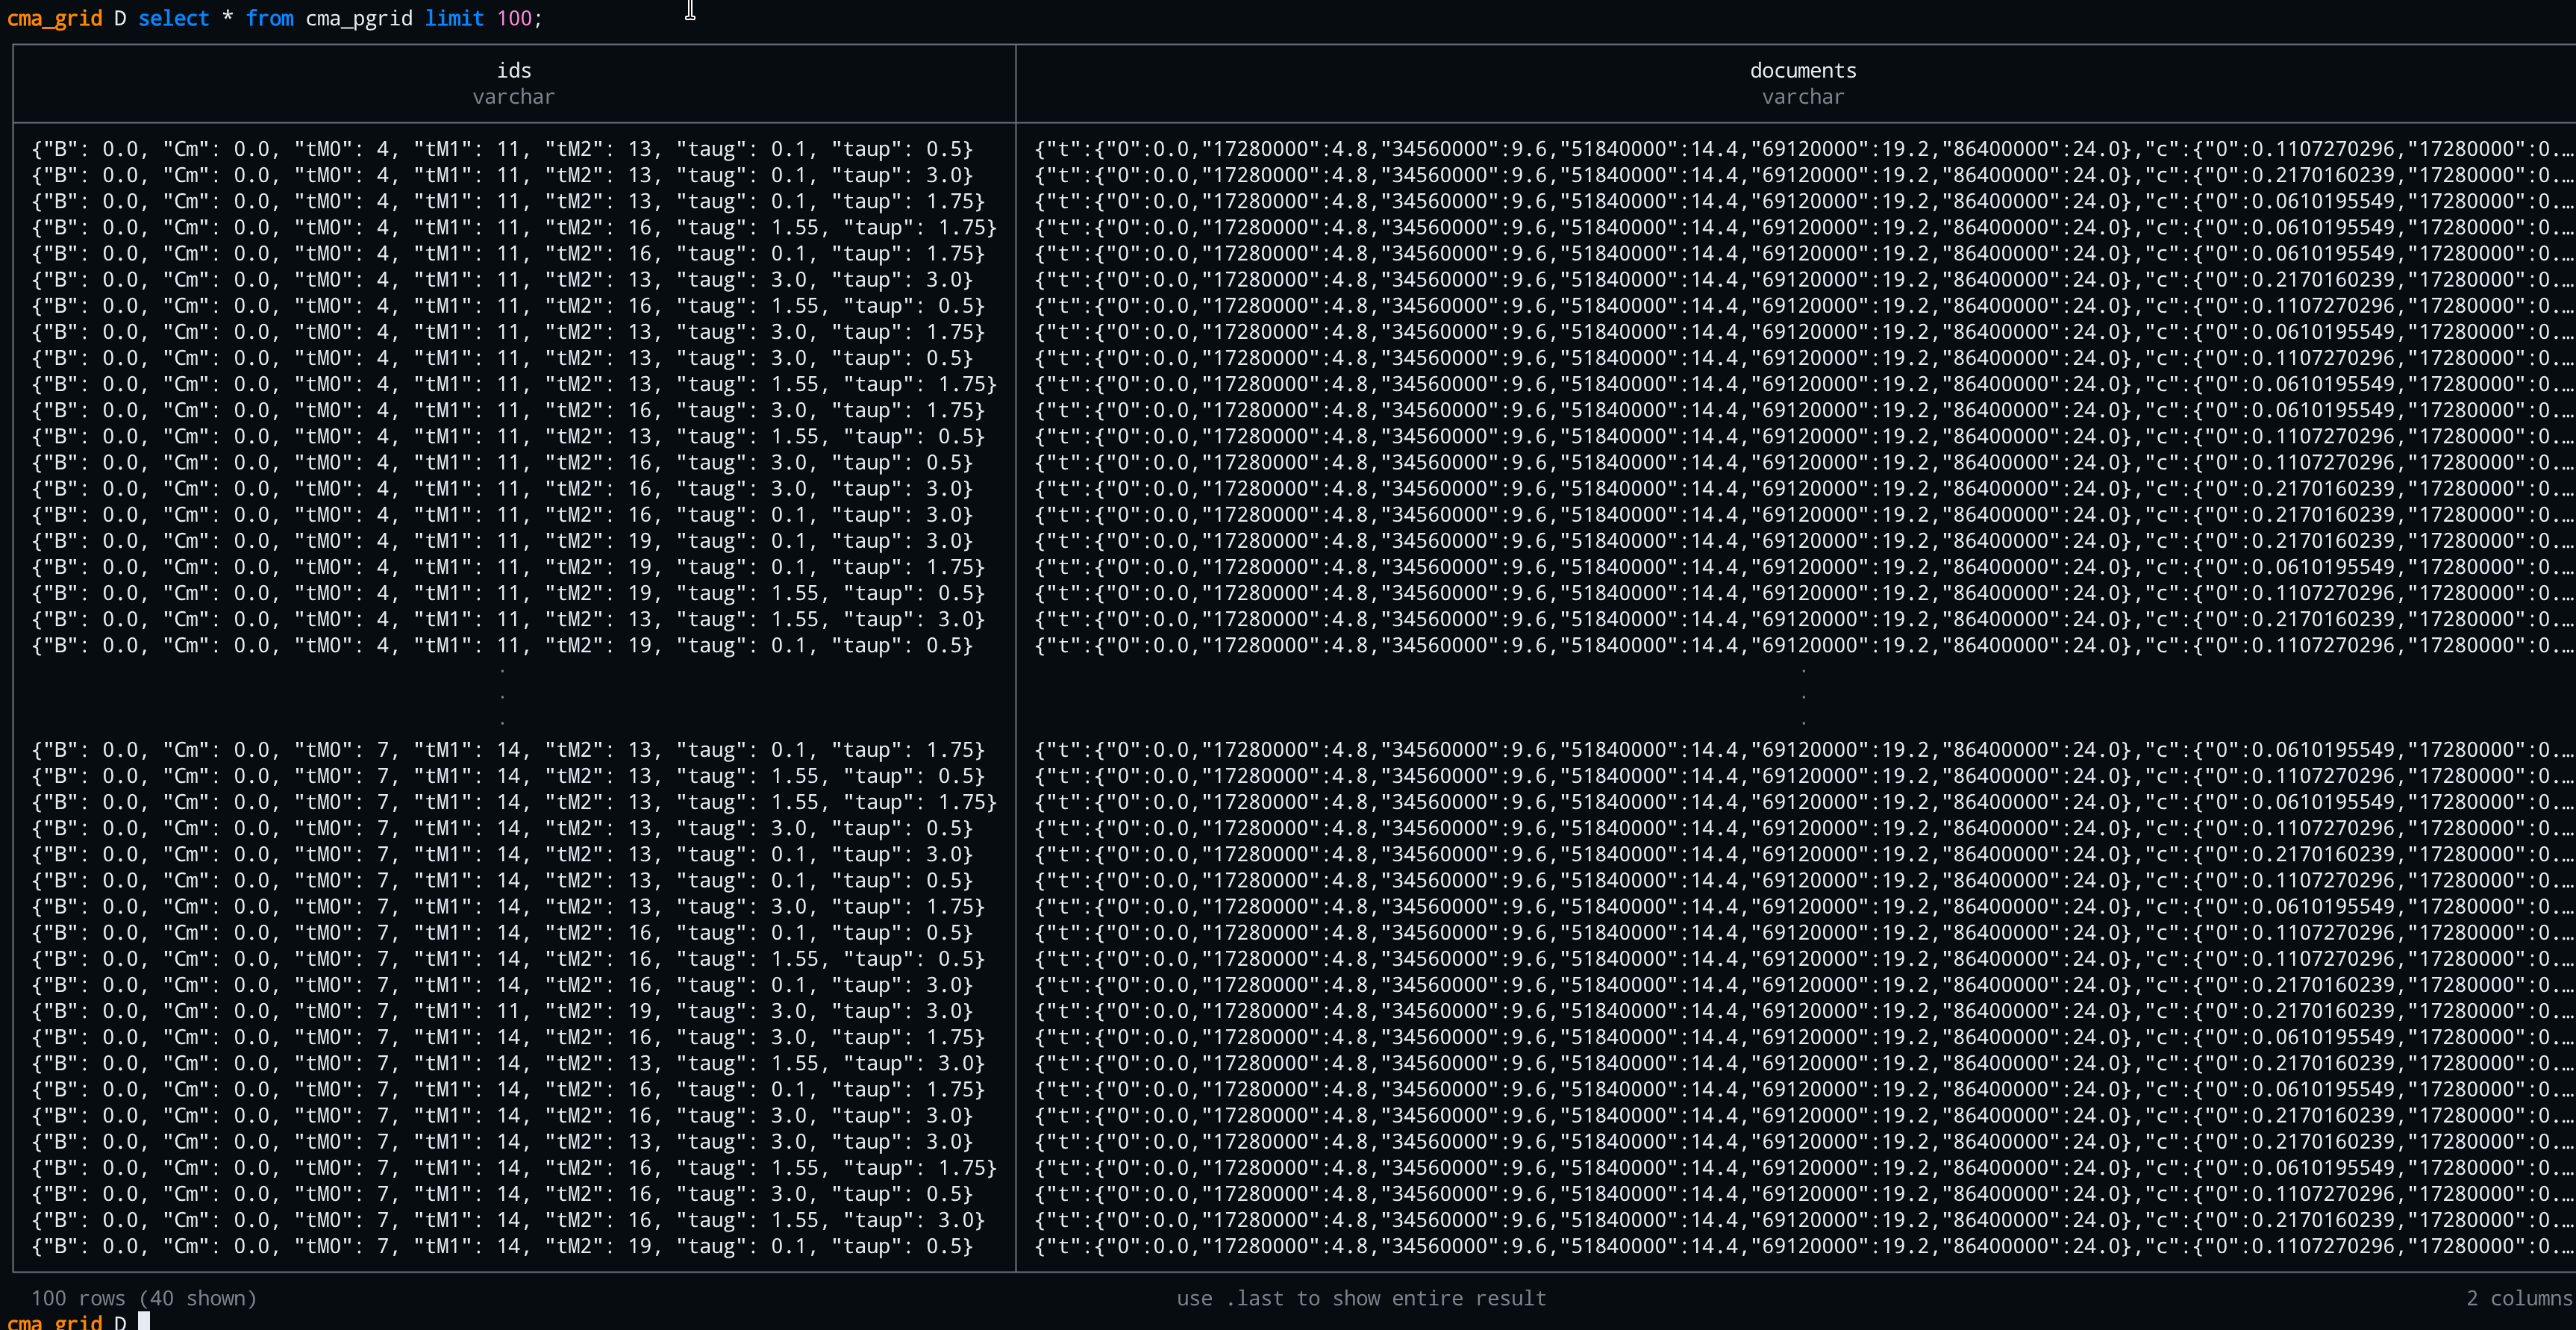
Precomputed parameter grids stored in DuckDB, visualized to explore the full CMA parameter space:
Model Output Visualizations
CMA Decomposition
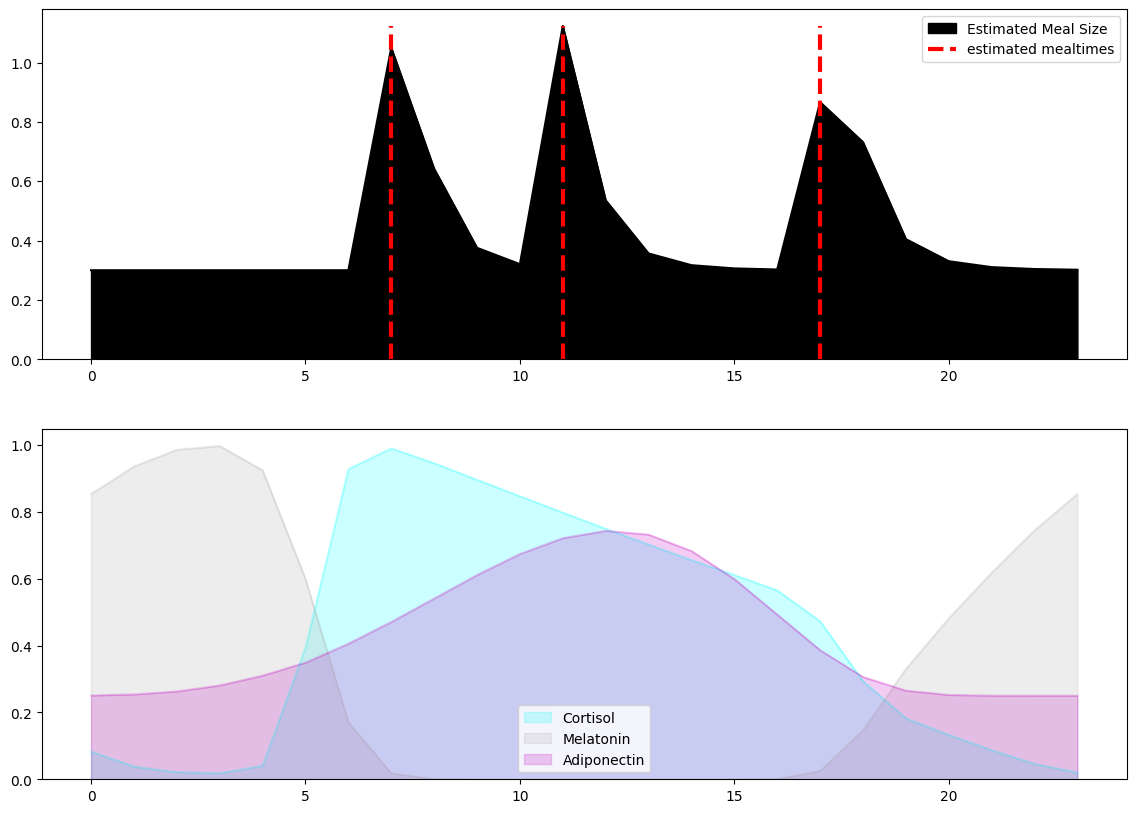
Full cortisol-melatonin-adiponectin decomposition from glucose time series:
Fit Results
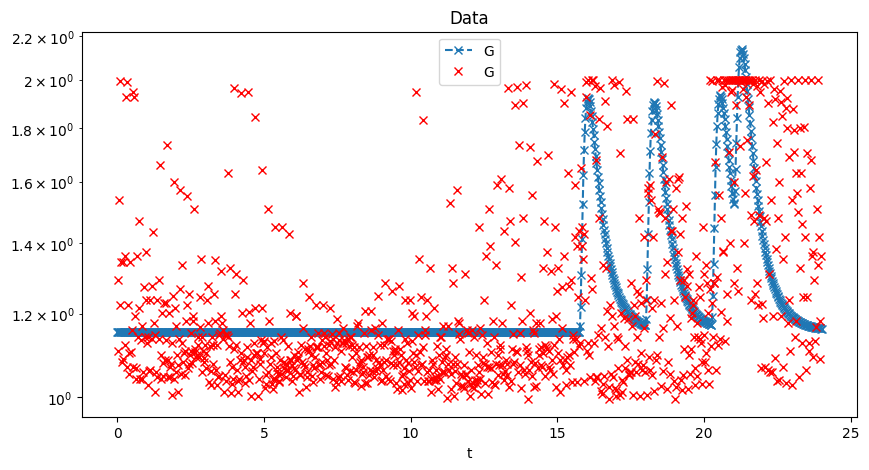
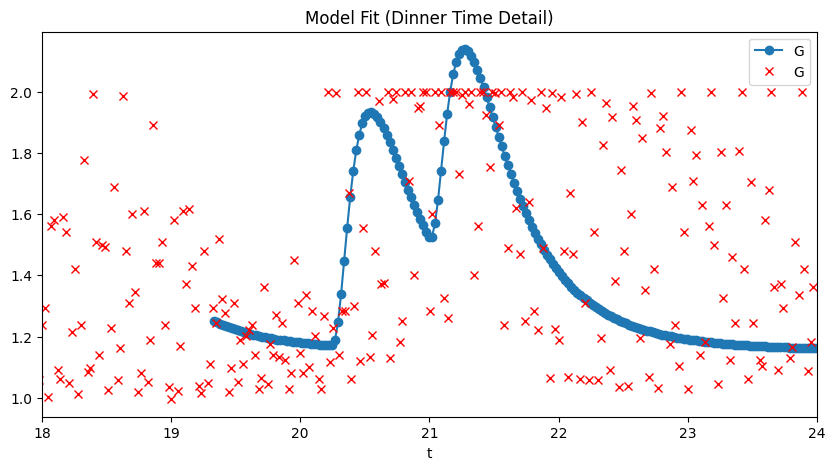
Side-by-side model fit (blue) vs. observed data (red):
Parameter Tables
Automatically generated parameter tables with qualitative descriptors:

Video Demos
Real-Time Data Streaming
A screencast demonstrating the real-time WebSocket data streaming interface:
Available Demo Endpoints
When running the dev server (uv run fastapi dev pfun_cma_model/app.py --port 8001):
| Demo | URL | Description |
|---|---|---|
| LLM Scenario | /demo/llm |
Natural language → scenario generation |
| Run-at-Time | /demo/run-at-time |
WebSocket + Chart.js live plotting |
| Canvas Wave | /demo/canvas-wave |
HTML5 Canvas wave equation visualization |
| Full Model Run | /demo/full-model-run |
Complete CMA model with all signals |
| WebGL Plot | /demo/webgl-demo |
GPU-accelerated real-time plotting |
| Data Stream | /demo/data-stream |
Server-sent data streaming |