pfun-cma-model
CMA Model Overview
The Cortisol-Melatonin-Adiponectin Model
The CMASleepWakeModel is a physiological model that decomposes glucose dynamics into three primary hormonal components that govern circadian metabolic regulation:
graph LR
    subgraph "Circadian Inputs"
        L["☀️ Light / Photoperiod"]
        T["🕐 Time of Day"]
    end

    subgraph "Hormonal Signals"
        C["Cortisol (c)"]
        M["Melatonin (m)"]
        A["Adiponectin (a)"]
    end

    subgraph "Metabolic Output"
        IS["Insulin Sensitivity (I_S)"]
        IE["Insulin Effect (I_E)"]
        G["Glucose (G)"]
    end

    L --> C
    L --> M
    T --> C
    T --> M
    C --> A
    M --> A
    C --> IS
    M --> IS
    A --> IE
    IS --> IE
    IE --> G
Signal Components
Cortisol (c)
Cortisol follows a dawn-peak pattern, driven by the hypothalamic-pituitary-adrenal (HPA) axis. In the model, cortisol is sensitive to light exposure and peaks shortly after waking.
\[c(t) \propto E\left[(L - 0.88)^3\right] \cdot E\left[0.05 \cdot (8 - t + d)\right] \cdot E\left[2 \cdot (-m)^3\right]\]Melatonin (m)
Melatonin is the darkness hormone, inversely related to light exposure. It governs sleep-wake transitions:
\[m(t) = (1 - L)^3 \cdot \cos^2\left(\frac{-(t - 3 - d) \cdot \pi}{24}\right)\]Adiponectin (a)
Adiponectin modulates insulin sensitivity and interacts with both cortisol and melatonin:
\[a(t) = \frac{E\left[(-c \cdot m)^3\right] + e^{-0.025(t - 13 - d)^2} \cdot L(0.7(27 - t + d))}{2}\]Glucose (G)
Post-prandial glucose is computed as a vectorized function of insulin effect, meal times, and response kinetics:
\[G(t) = \sum_{i=1}^{n_{\text{meals}}} g_i(t, I_E, t_{M_i}, \tau_g, B, C_m, t_{\text{off}})\]Example: Running the Model
from pfun_cma_model import CMASleepWakeModel

# Default parameters — healthy individual at baseline
cma = CMASleepWakeModel(N=288)

# Run and inspect
df = cma.run()
print(df[['t', 'c', 'm', 'a', 'G']].head(10))
| Signal | Description | Key Property |
|---|---|---|
c |
Cortisol | Dawn-peaking stress hormone |
m |
Melatonin | Darkness-activated sleep signal |
a |
Adiponectin | Insulin sensitivity modulator |
I_S |
Insulin Sensitivity | 1.0 - 0.23c - 0.97m |
I_E |
Insulin Effect | a × I_S |
G |
Glucose | Summed post-prandial response |
Decomposition Visualization
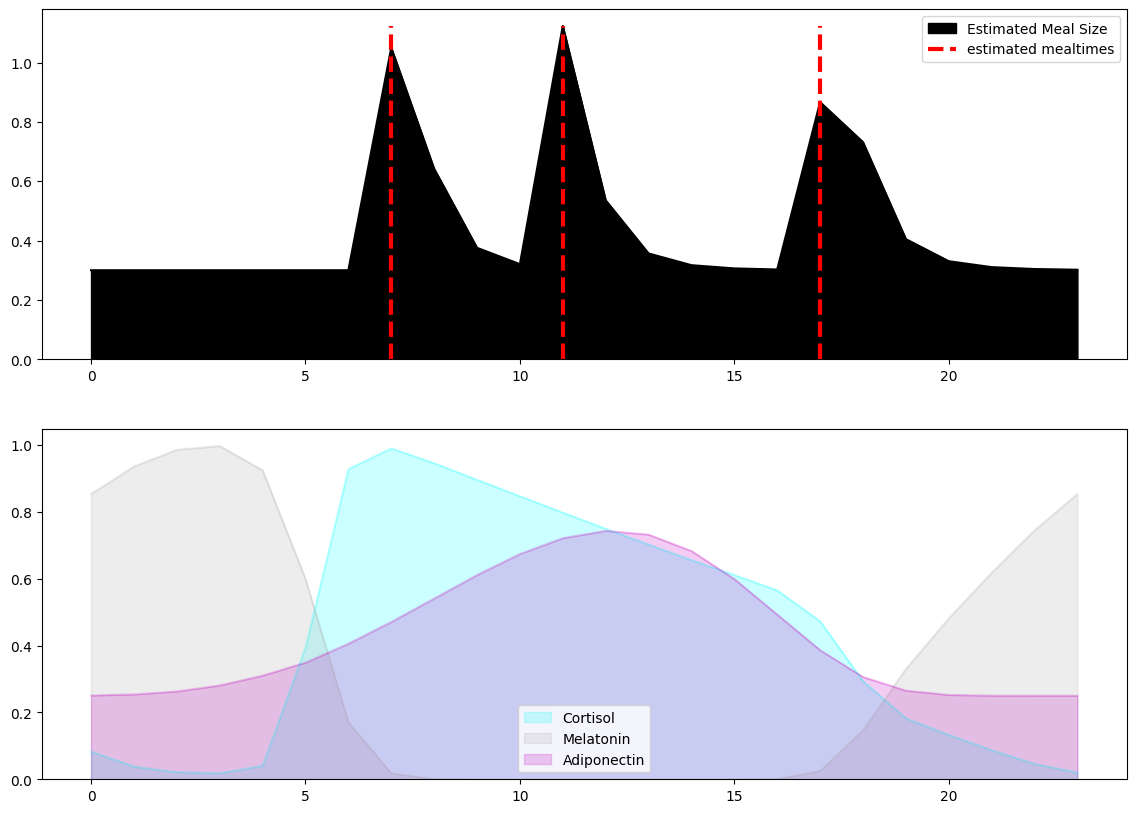
The plot above shows a typical CMA decomposition from glucose time series data, revealing the underlying hormonal dynamics across a 24-hour period.
Key Class: CMASleepWakeModel
class CMASleepWakeModel:
    """Cortisol-Melatonin-Adiponectin Sleep-Wake Model.

    Core workflow:
    1) Input SG → Project to 24-hour phase plane.
    2) Estimate photoperiod → Model params (d, τp).
    3) Fit to projected SG → Compute chronometabolic dynamics.
    """

    def __init__(self, config=None, **kwds):
        """Initialize with CMAModelParams or keyword arguments."""

    def run(self) -> pd.DataFrame:
        """Run the model, return solution as labeled DataFrame."""

    def update(self, model_params=None, inplace=True, **kwds):
        """Update parameters in-place or return a new instance."""

    @property
    def G(self) -> np.ndarray:
        """Post-prandial glucose dynamics."""

    @property
    def g_instant(self) -> np.ndarray:
        """Instantaneous (summed) glucose across all meals."""

    def calc_Gt(self, t=None, dt=None, n=1) -> pd.DataFrame:
        """Calculate glucose at arbitrary future time points."""
→ Next: Model Parameters