pfun-cma-model
Model Fitting
Overview
The fit_model function uses scipy.optimize.minimize (L-BFGS-B by default) to fit the CMA model to observed glucose data. It returns a CMAFitResult containing the optimized parameters, the model solution, and diagnostic information.
flowchart LR
    A["Raw CGM Data"] --> B["format_data()"]
    B --> C["estimate_mealtimes()"]
    C --> D["curve_fit()"]
    D --> E["CMAFitResult"]
    E --> F["Optimized Parameters"]
    E --> G["Solution DataFrame"]
    E --> H["Covariance Matrix"]
Python API
Basic fitting
import pandas as pd
from pfun_cma_model import fit_model

# Load CGM data (columns: 't' for time in hours, 'G' for glucose)
data = pd.read_csv("cgm_data.csv")

# Fit with defaults
result = fit_model(data)

# Access results
print(result.popt_named)    # Named optimized parameters
print(result.soln.head())   # Model solution DataFrame
print(result.cond)          # Condition number of covariance matrix
Custom fitting
result = fit_model(
    data,
    N=1024,                   # Number of output time points
    tcol="t",                 # Time column name
    ycol="G",                 # Glucose column name
    tM=[7.0, 12.0, 18.0],    # Fixed meal times (skip estimation)
    tm_freq="2h",             # Frequency for mealtime estimation
    curve_fit_kwds={
        "method": "L-BFGS-B",
        "ftol": 1e-18,
        "xtol": 1e-18,
        "max_nfev": 150000,
    },
)
Mealtime Estimation
If meal times are not provided, they are automatically estimated from the glucose data using peak-detection:
from pfun_cma_model.engine.fit import estimate_mealtimes

# Estimate meal times from glucose peaks
meal_times = estimate_mealtimes(data, ycol="G", tm_freq="2h", n_meals=4)
print(meal_times)
# array([ 7.2, 12.1, 17.8, 21.3])
CMAFitResult
The CMAFitResult is a Pydantic model containing:
| Field | Type | Description |
|---|---|---|
soln |
pd.DataFrame |
Full model solution (all signals) |
formatted_data |
pd.DataFrame |
Input data after formatting |
cma |
CMASleepWakeModel |
Fitted model instance |
popt |
np.ndarray |
Optimized parameter vector |
pcov |
np.ndarray |
Estimated covariance matrix |
popt_named |
dict |
Parameters as {name: value} |
cond |
float |
Condition number of covariance |
diag |
np.ndarray |
Diagonal of covariance matrix |
mesg |
str |
Optimizer message |
ier |
int |
Convergence status code (0 = success) |
Serialization
# Save as JSON
with open("results/fit_result.json", "w") as f:
    f.write(result.model_dump_json())

# Load back (via dict)
import json
data = json.loads(result.model_dump_json())
CLI Fitting
# Fit model with sample data and plot the result
uv run pfun-cma-model fit-model --plot

# Fit with custom input file
uv run pfun-cma-model fit-model \
  -i path/to/cgm_data.csv \
  -o results/ \
  --N 1024 \
  --plot

# Override output format
uv run pfun-cma-model fit-model --plot --ftype svg
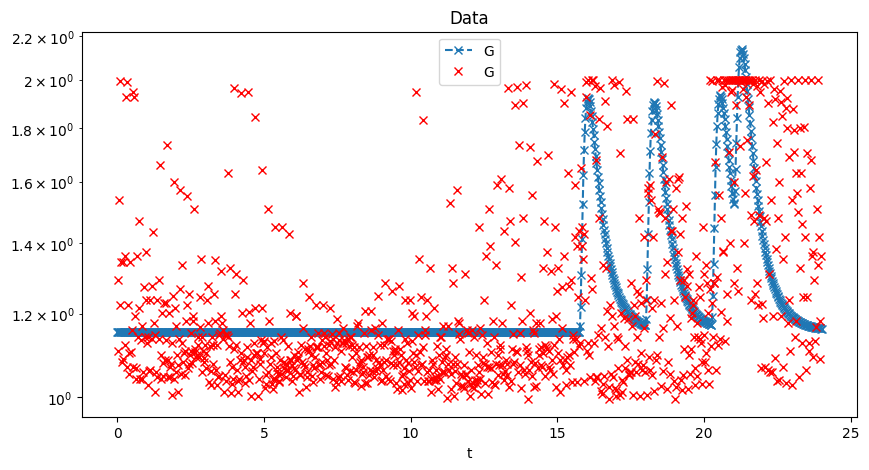
Visual Results
24-Hour Fit
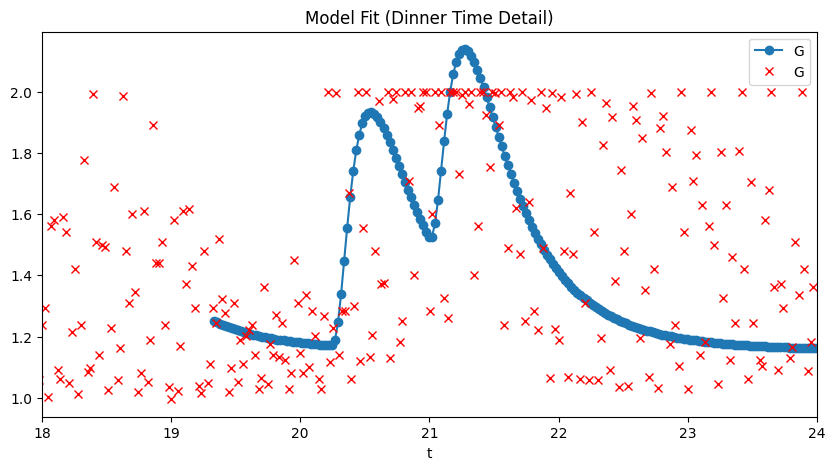
Dinner Period Fit
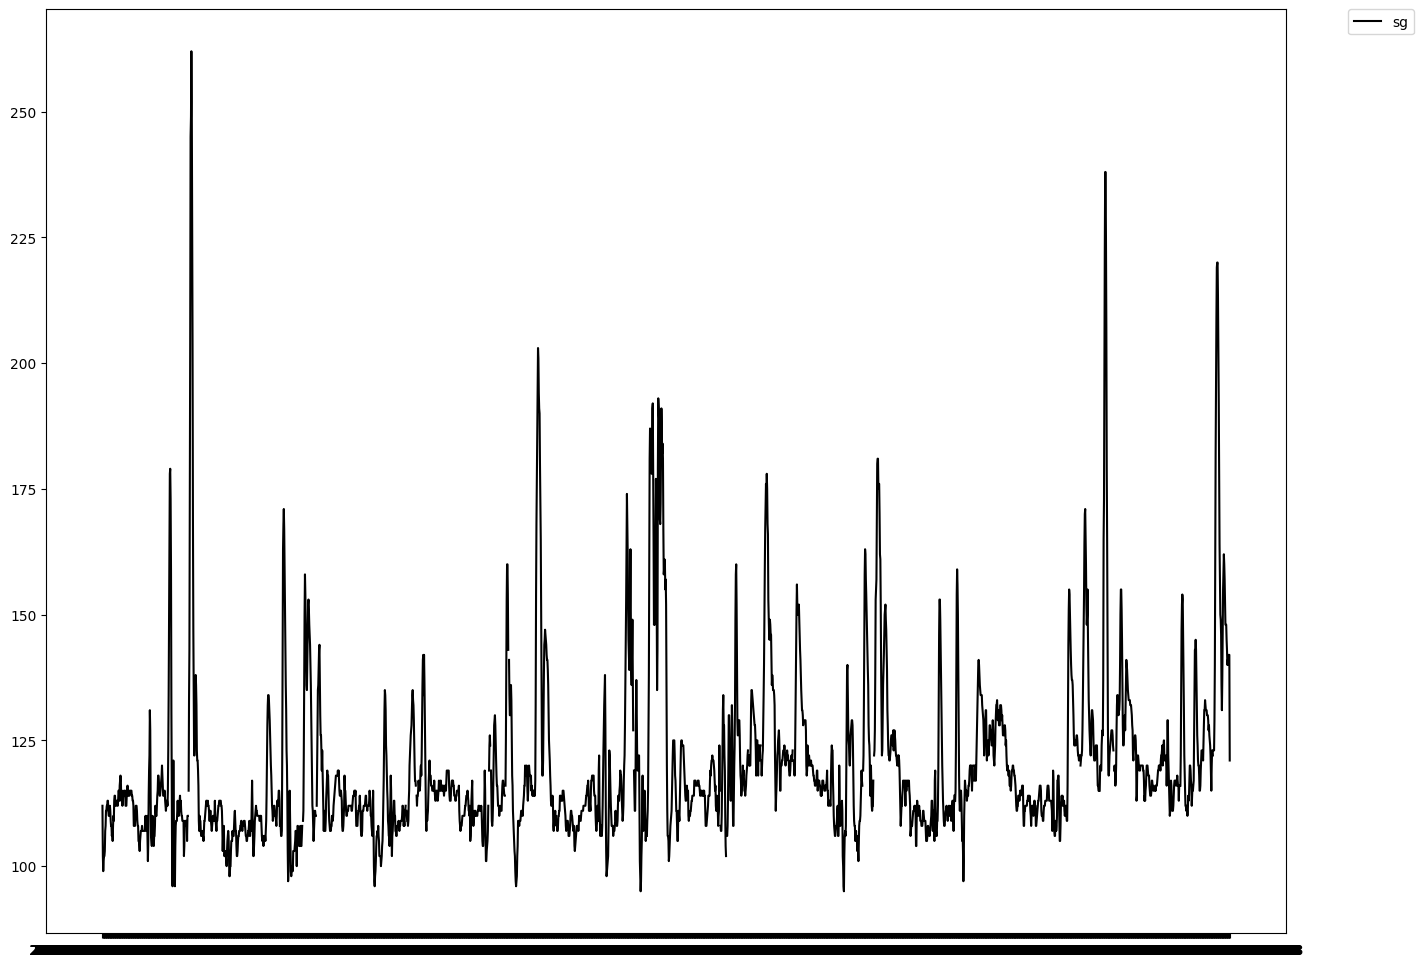
Sample Data
Optimization Details
The fitting pipeline uses L-BFGS-B (Limited-memory Broyden–Fletcher–Goldfarb–Shanno with Bound constraints) by default:
- Objective: Minimize
Σ(y_observed - G_model)² - Bounds: All bounded parameters are constrained (see Parameters)
- Convergence:
ftol=1e-18,xtol=1e-18,max_nfev=N×1000
Alternative methods supported: Nelder-Mead, Powell, TNC, trust-constr.
→ Next: Demos & Examples